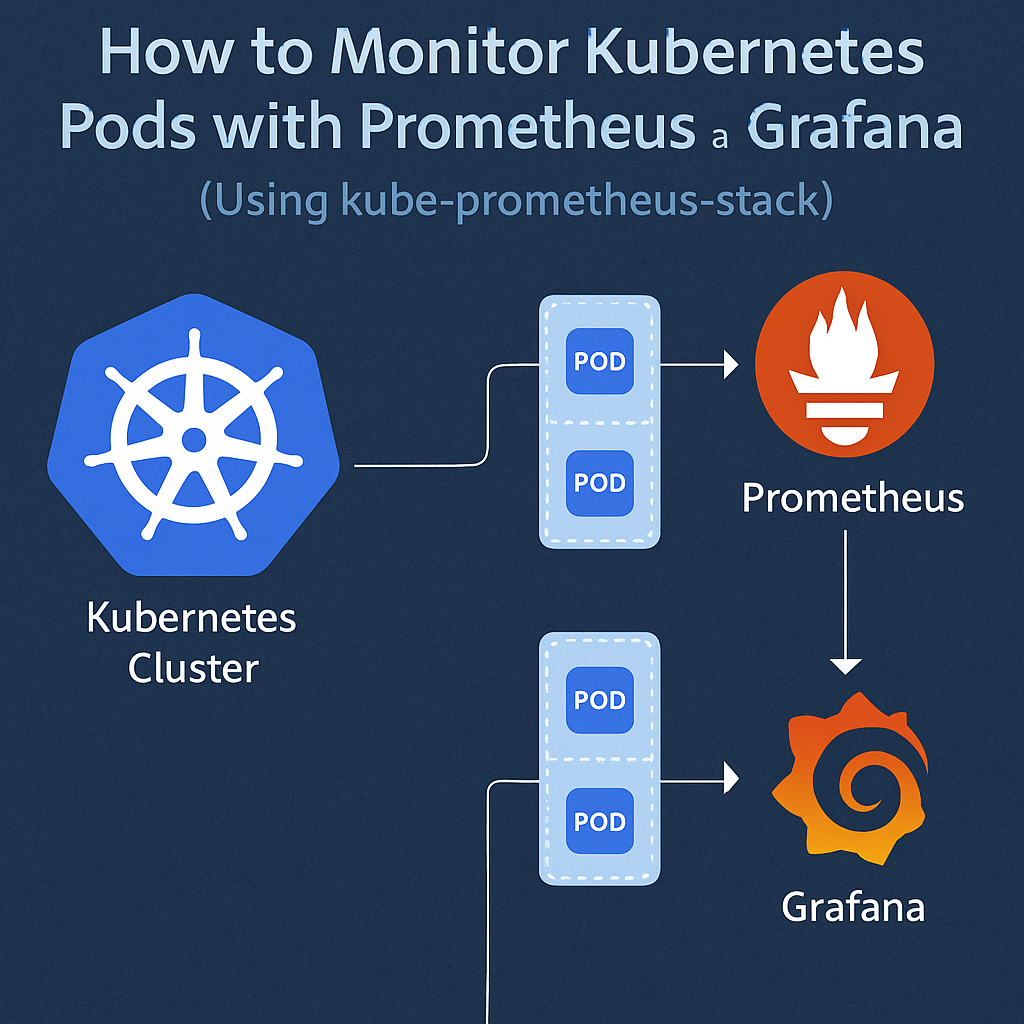
Set up monitoring and alerting for Kubernetes clusters using Prometheus and Grafana.
Monitoring is essential for maintaining the health and performance of your Kubernetes environment. Without proper visibility, identifying issues and optimizing performance becomes difficult. Prometheus and Grafana provide a powerful combination for collecting metrics and visualizing data.
In this article, you’ll learn how to set up monitoring for your Kubernetes cluster, configure alerts, and build dashboards for real-time insights. With the right monitoring setup, you can proactively detect issues and ensure your applications run smoothly.